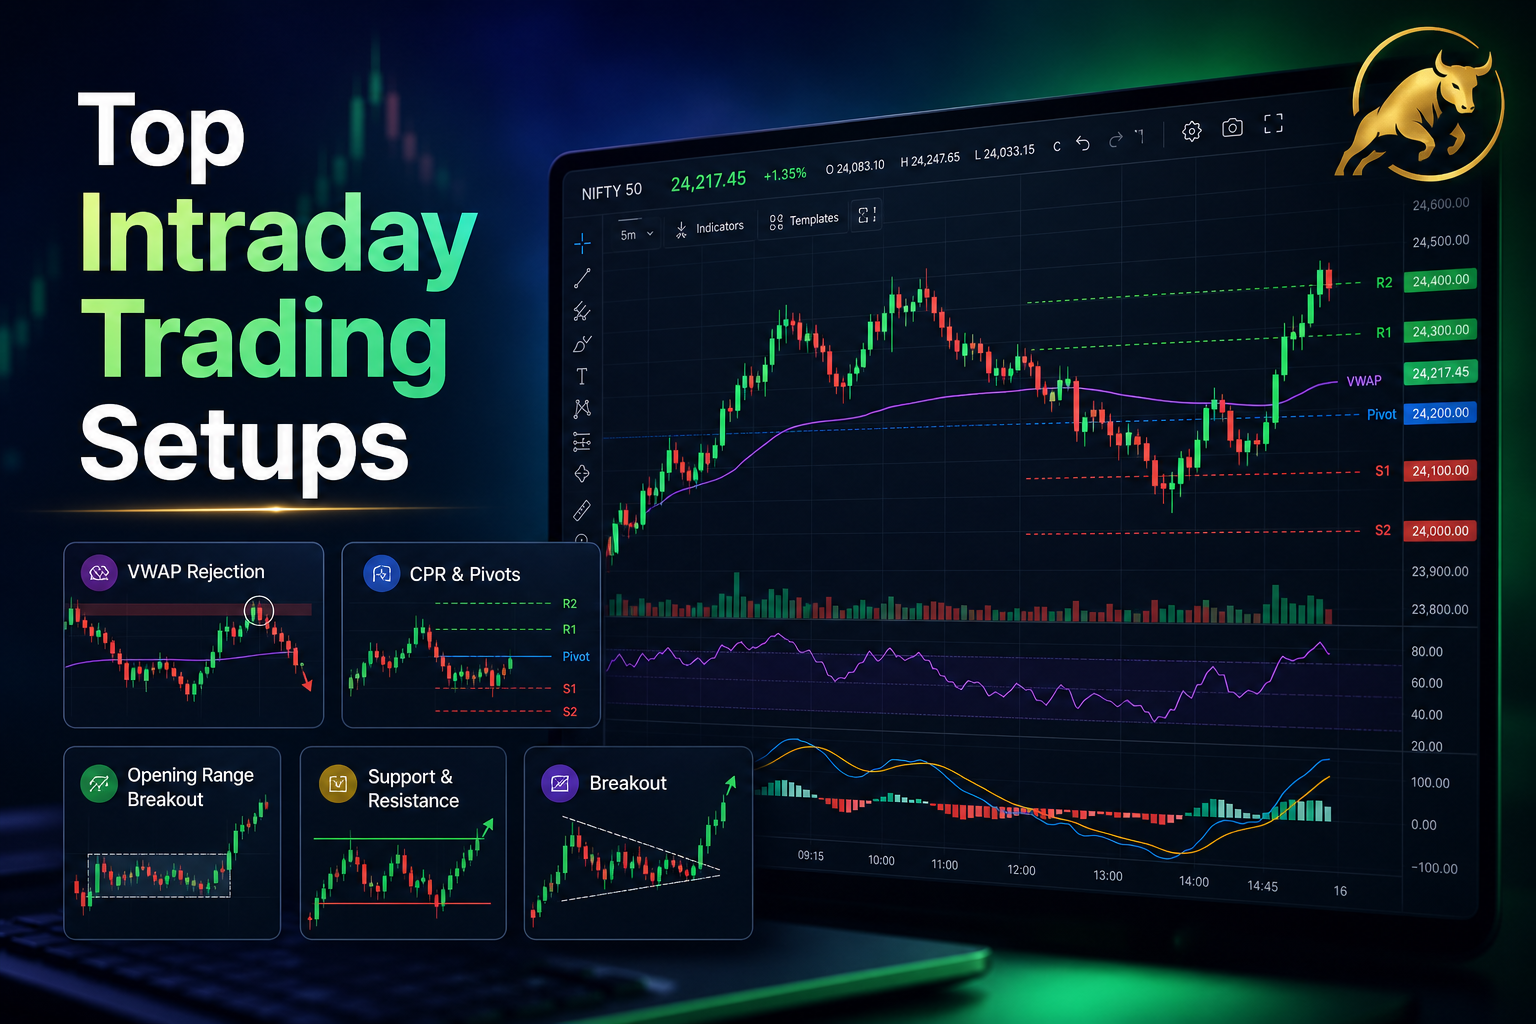
A great trading setup turns random screen-watching into a repeatable, rule-based process. Instead of reacting to every tick, you wait for a specific pattern of price, levels, and confirmation, then execute with a defined entry, stop loss, and target. In this guide we break down five high-probability intraday trading setups with chart examples you can apply to Nifty, Bank Nifty, and stocks.
What Is a Trading Setup?
A trading setup is a predefined combination of conditions that signals a potential trade. Every solid setup answers three questions: where do I enter, where is my stop loss, and where do I take profit. The setups below are popular precisely because they give clear, objective answers to all three.
1. VWAP Rejection Setup
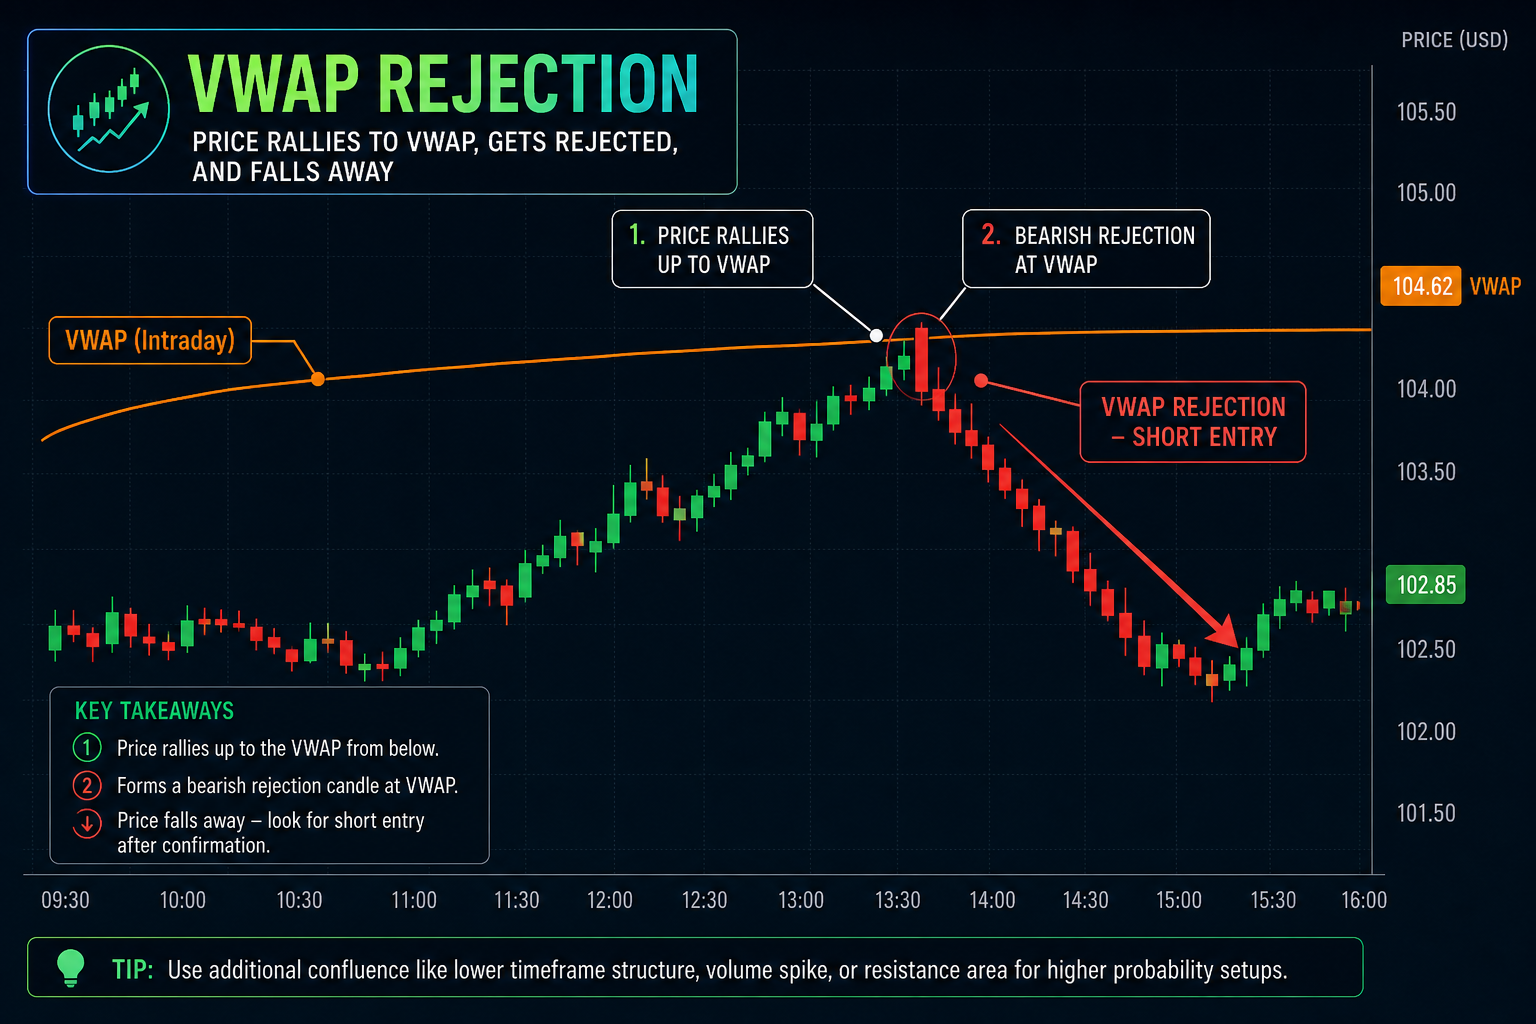
The VWAP rejection setup uses the Volume Weighted Average Price as a dynamic level. When price rallies up to the VWAP from below and fails to break through, it often signals that sellers are defending the level.
- Entry: Short after a bearish rejection candle forms at VWAP.
- Stop loss: Just above the VWAP line or the rejection candle's high.
- Target: Recent intraday support or a fixed risk-reward of 1:2.
- Confluence: Stronger when VWAP aligns with a resistance zone or volume spike.
2. Pivot Point & CPR Strategy
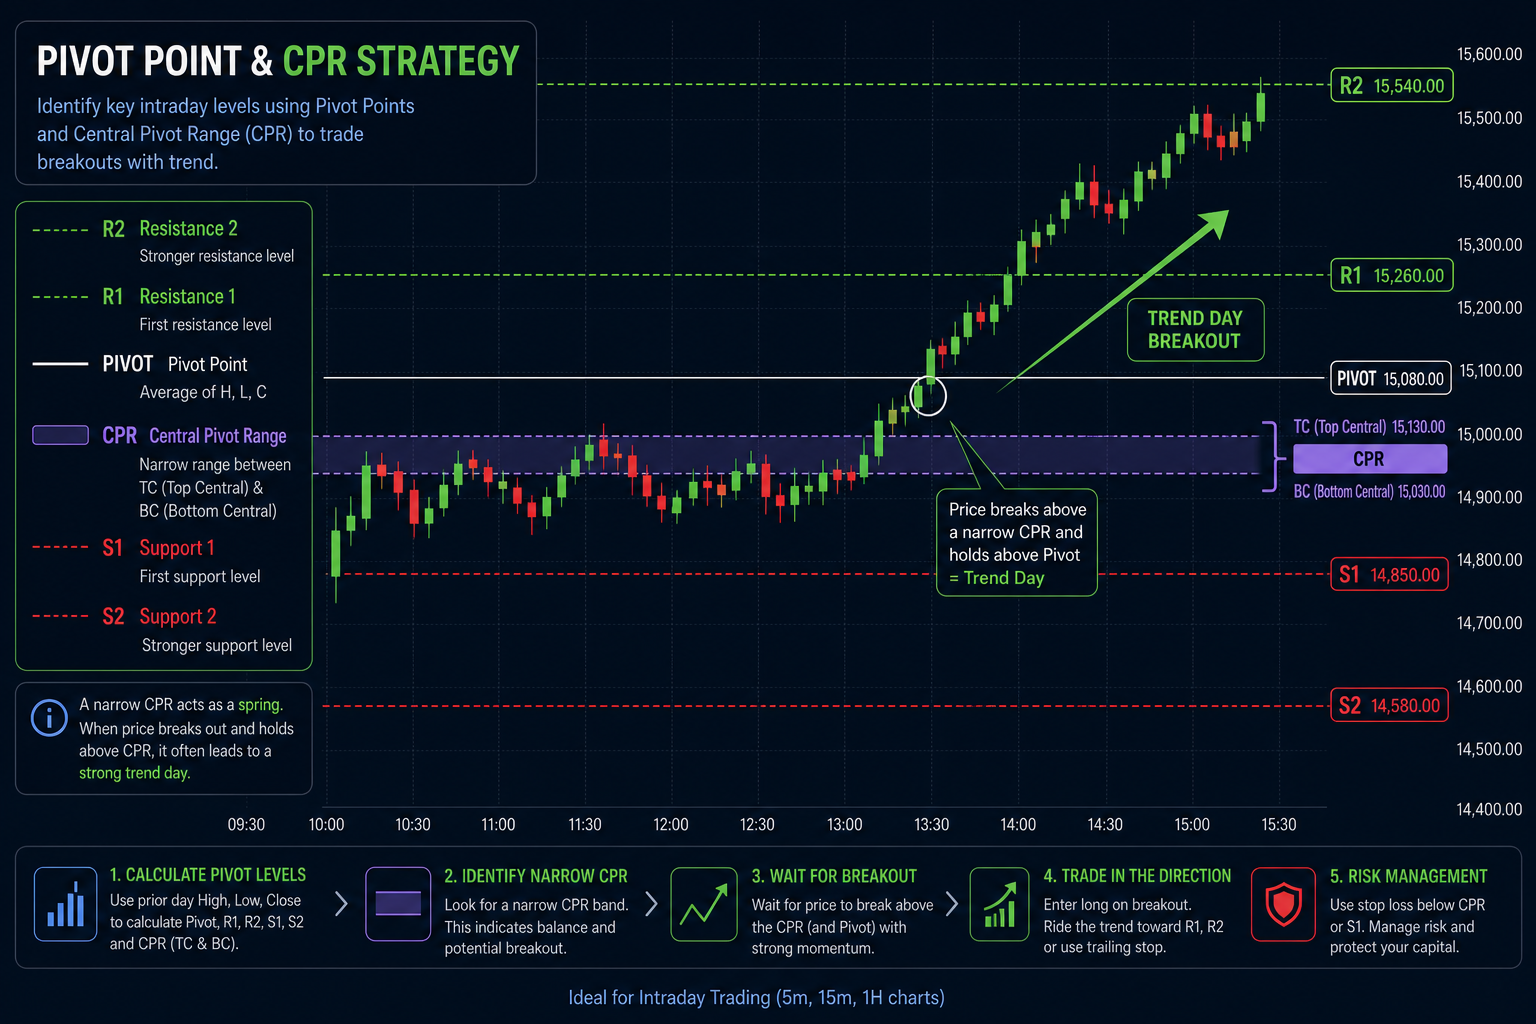
The pivot point and CPR strategy maps key intraday levels from the previous day's high, low, and close. The Central Pivot Range (CPR), the band between the top and bottom central levels, is especially powerful for reading the day's character.
- Narrow CPR: Signals potential trending day, watch for breakouts above/below.
- Wide CPR: Suggests a range-bound or sideways day.
- Entry: Long when price breaks and holds above the CPR and pivot; short below.
- Targets: R1/R2 for longs, S1/S2 for shorts, with stops near the CPR.
3. Opening Range Breakout (ORB)
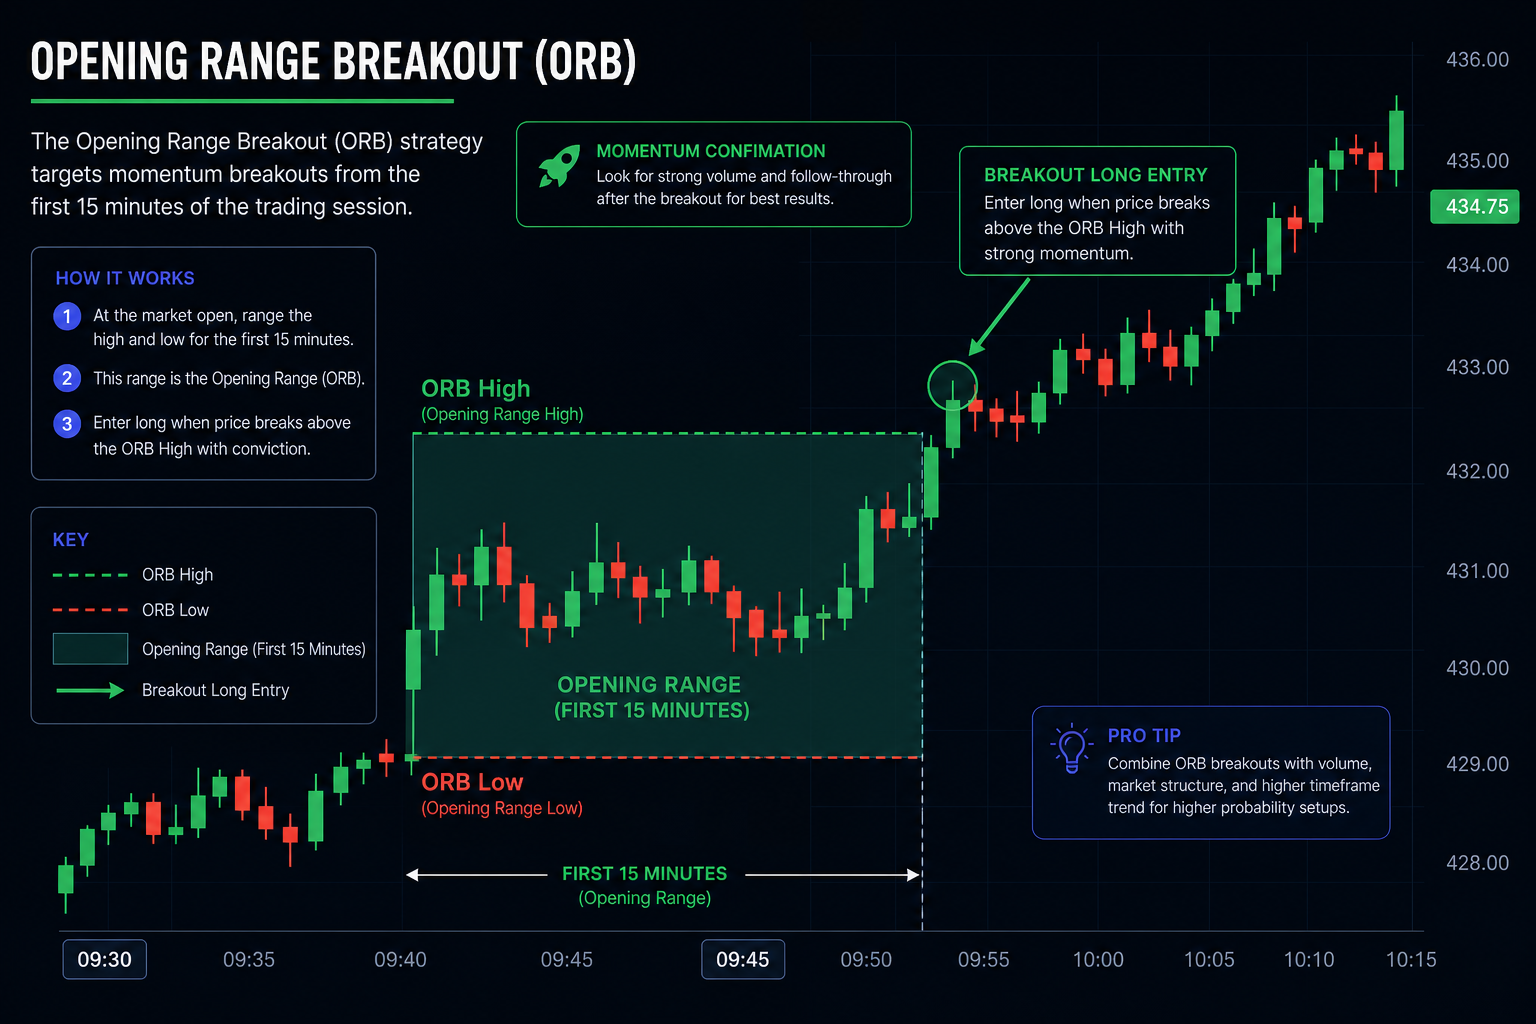
The opening range breakout is a classic momentum setup. You mark the high and low of the first 15 minutes (the opening range), then trade a decisive break of that range.
- Entry: Long when price breaks above the ORB high; short below the ORB low.
- Stop loss: The opposite side of the opening range.
- Target: A multiple of the range height, or trail with a moving average.
- Confirmation: Look for strong volume and follow-through after the break.
4. Support and Resistance Setup
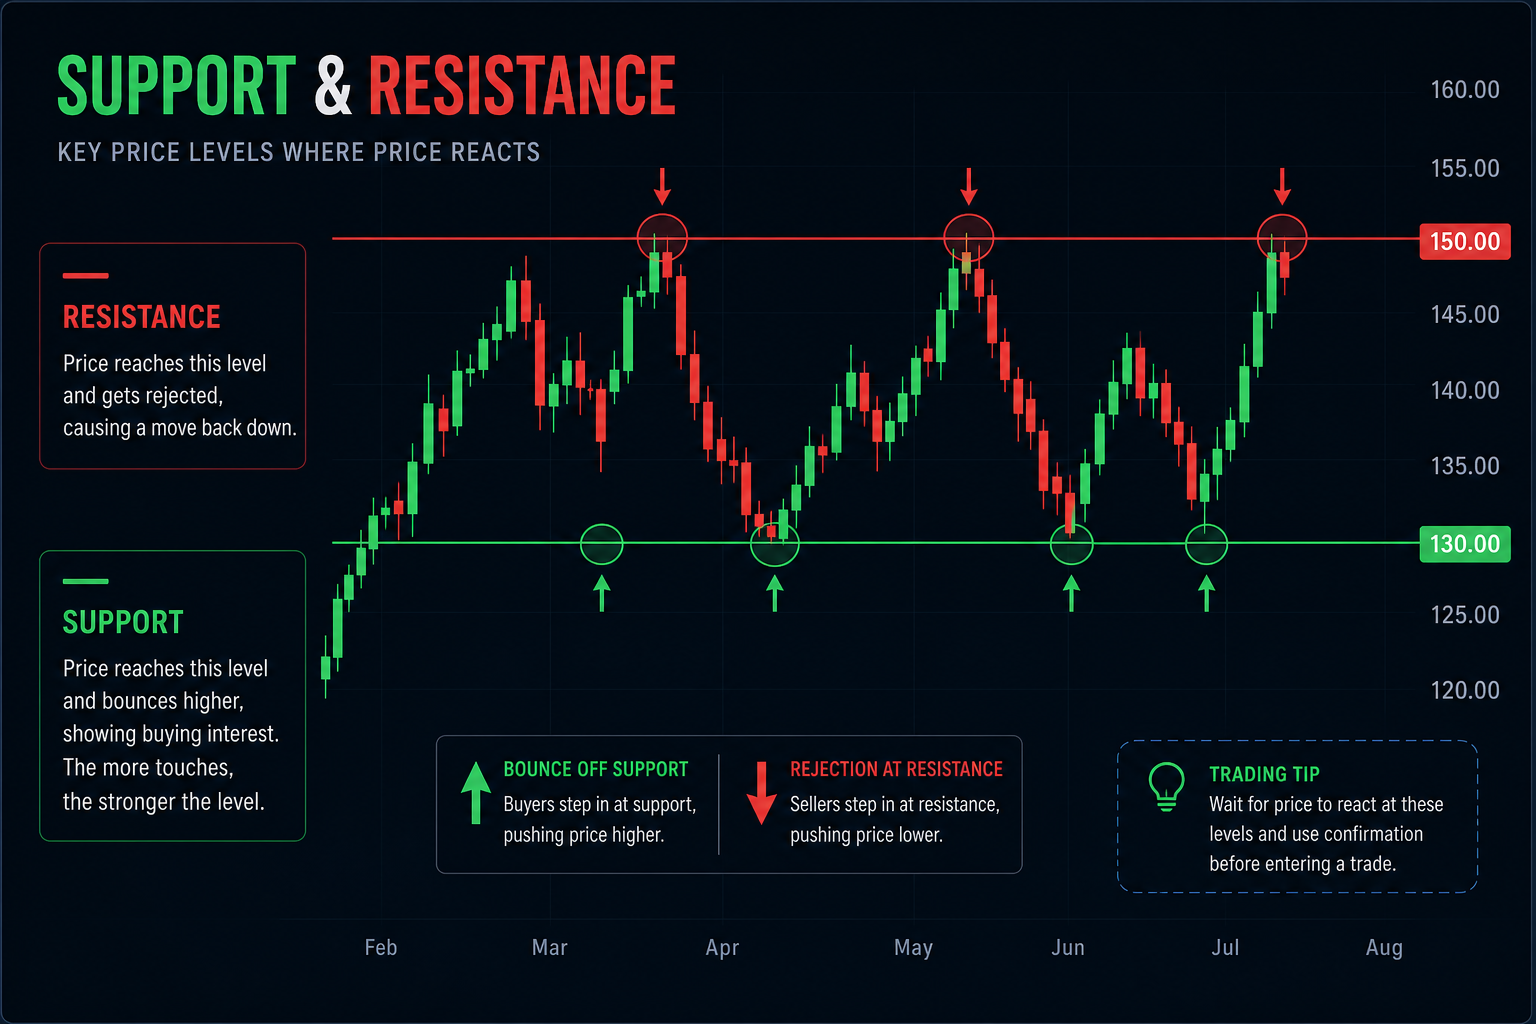
Support and resistance are the foundation of price action trading. Support is a level where buyers repeatedly step in; resistance is where sellers take control. These levels give you objective zones to enter, exit, and place stops.
- Buy setup: Enter long on a bullish reaction at support.
- Sell setup: Enter short on a bearish rejection at resistance.
- Stop loss: Just beyond the level being traded.
- Strength: The more times a level holds, the more significant it becomes.
5. Breakout Setup
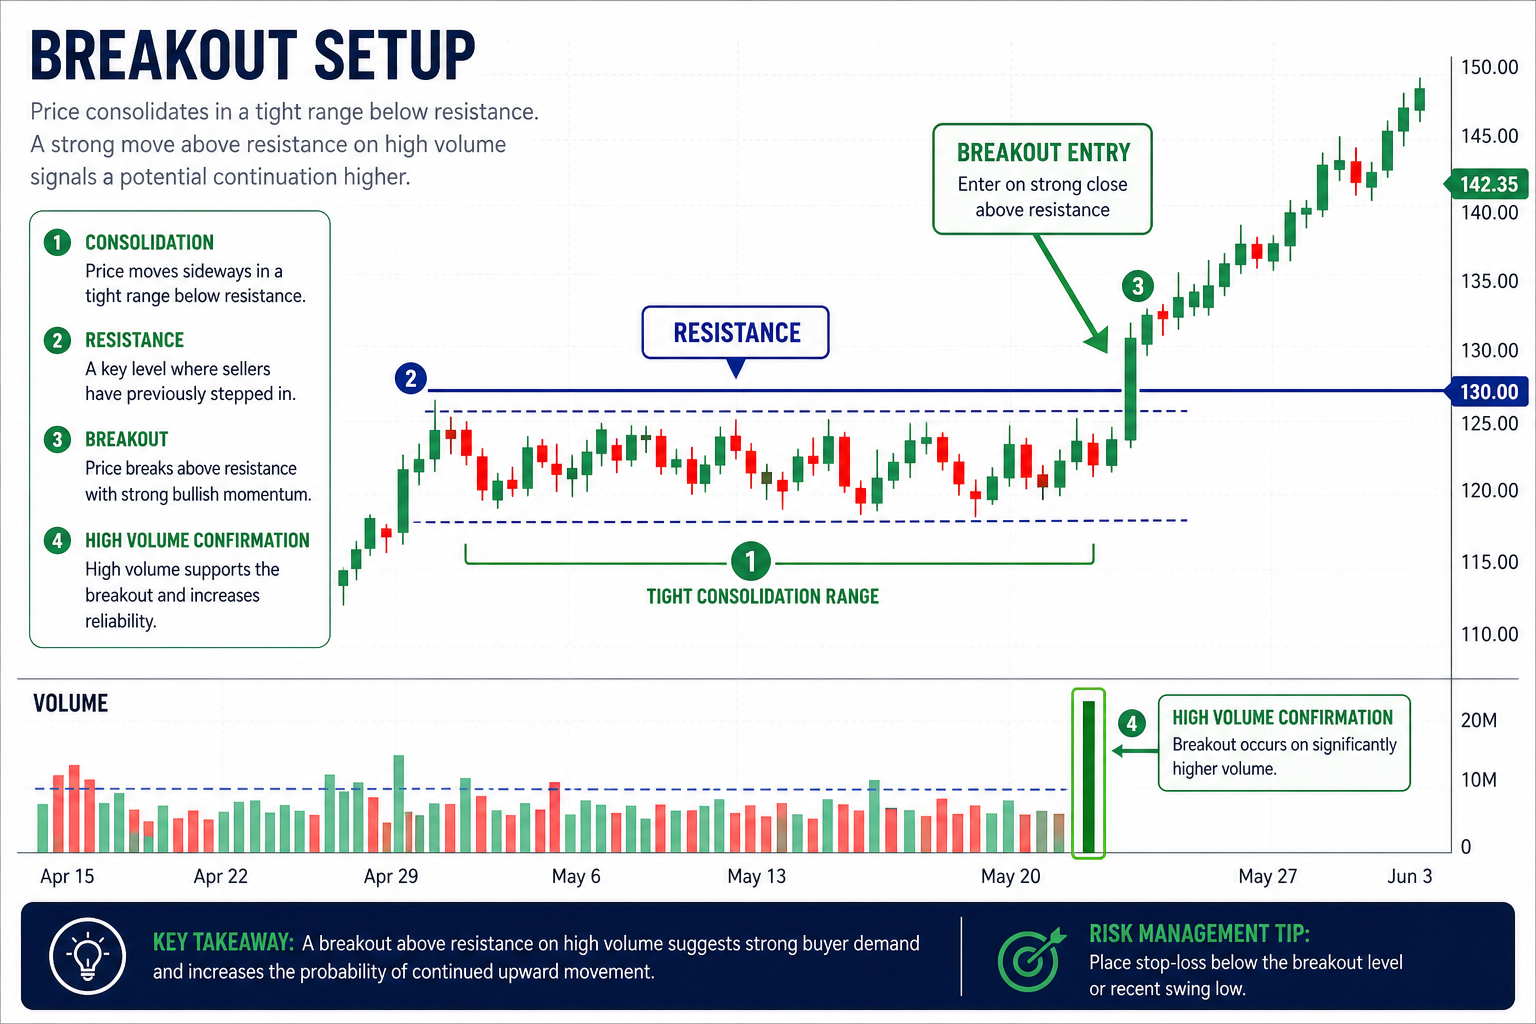
The breakout setup captures the move when price escapes a tight consolidation. After a period of sideways action below resistance, a strong move above it on rising volume often leads to a trending continuation.
- Entry: On a strong close above resistance (or below support for short breakouts).
- Volume: A genuine breakout is confirmed by a clear spike in volume.
- Stop loss: Below the breakout level or recent swing low.
- Beware: Low-volume breakouts often fail, watch for false breakouts (fakeouts).
Quick Comparison of the 5 Trading Setups
| Setup | Type | Best Market Condition |
|---|---|---|
| VWAP Rejection | Mean reversion | Range / pullback days |
| Pivot & CPR | Level-based | Trend & range days |
| Opening Range Breakout | Momentum | Volatile opens |
| Support & Resistance | Price action | Range-bound markets |
| Breakout | Momentum | Trending / expansion days |
How to Practice These Trading Setups Risk-Free
Knowing a setup and executing it under live pressure are two different things. The smartest way to build skill is to practice each trading setup on a simulator before risking real money. With MegaBull, you can:
- Trade these setups on real-time NSE data with Rs 5 Lakhs virtual capital
- Mark VWAP, pivots, CPR, and support/resistance with professional charting tools
- Track your win rate and refine each setup with detailed analytics
- Build discipline and consistency, completely free
Frequently Asked Questions
What is a trading setup?
A trading setup is a specific, repeatable set of conditions that signals a potential entry into a trade. It combines price action, key levels, and indicators (like VWAP, pivots, or support and resistance) to define when to enter, where to place a stop loss, and where to take profit.
Which trading setup is best for beginners?
Support and resistance and the opening range breakout (ORB) are among the most beginner-friendly trading setups because they rely on clear, visible price levels. Beginners should practice any setup on a paper trading simulator before using real money.
What is the VWAP rejection setup?
The VWAP rejection setup is when price rallies up to the Volume Weighted Average Price (VWAP), fails to break above it, and reverses lower. Traders use the rejection candle as a potential short entry, with a stop loss just above VWAP.
How can I practice these trading setups risk-free?
Use a paper trading app like MegaBull to practice trading setups with real-time NSE data and virtual capital. You can test VWAP rejection, CPR, ORB, support/resistance, and breakout setups without risking real money.
Conclusion
The best traders don't chase every move, they wait for a proven trading setup to line up. Master these five, VWAP rejection, pivot & CPR, opening range breakout, support & resistance, and breakout, and you'll trade with structure instead of emotion. Practice them on MegaBull until they become second nature, then take them live with confidence.